If you are into AI/ML, then you must have heard about the machine learning algorithm Linear Regression. It is a supervised learning method, i.e basically learning under some parameters and hyperparameters set by humans.
How does Linear Regression Work?
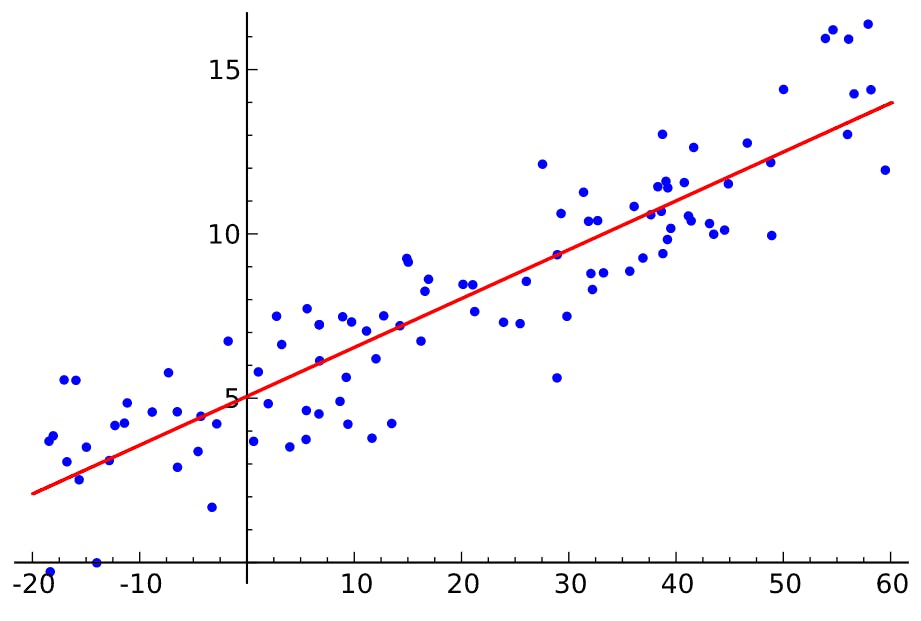
First, we need to understand what Regression is or means. Regression tells us about the trend line between the input and the output, i.e how the output(say y) varies with the input(say x). The corresponding trend line also called the Regression line looks like this-

The red line above is what the model predicts should be the trend line for the dataset it has been trained on and will further be predicting values based on the trend line. There are multiple types of regression algorithms but since the data points are varying linearly, hence the name. Linear Regression can be implemented in three ways for different kinds of datasets -
Simple Linear Regression
Multiple Linear Regression
Polynomial Linear Regression
Simple Linear Regression
This linear regression technique is used for data that has only one independent variable, called a feature in regression. The corresponding mathematical equation looks like
Y = b0 + b1xX1
where b0 and b1 are the coefficients and X1 is the only independent variable in the dataset and that's why the name Simple.
The visualization of the simple linear regression is already given above, so pls refer to that. Since we already have our values of X and Y from the training dataset, we shall focus on the coefficients. Now, in machine learning the algorithm's job is to find the values of the coefficients which fits the training dataset properly, once it has done that, we have our model ready.
Multiple Linear Regression
In this algorithm, the training dataset has multiple independent variables and the equivalent mathematical equation looks like
Y = b0 + b1xX1 + b2xX2 + b3xX3 + .... + bnxXn
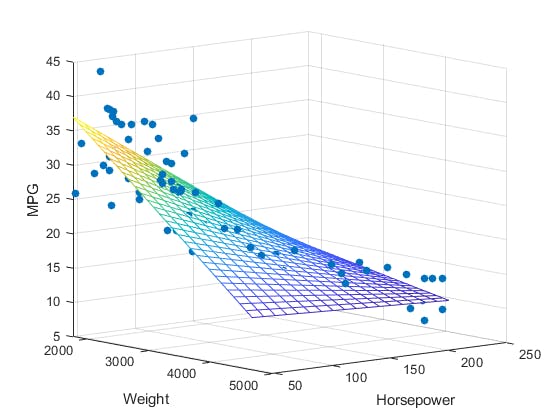
Now, since we have a lot of independent variables, we will be needing an n-dimensional visualization which won't be possible, so we will have to go with intuition. This is a more general case of linear regression, as a real-world dataset contains multiple columns and not just one column. Still, a visualization with 2 independent variables(3 dimensions) would look like

Polynomial Linear Regression
Polynomial Regression is similar to simple linear regression in the way that for both algorithms the dataset must contain only one independent variable. But, in polynomial regression, the mathematical equation looks like this
Y = b0 + b1xX1 + b2x(X1^2) + b3x(X1^3) + ....
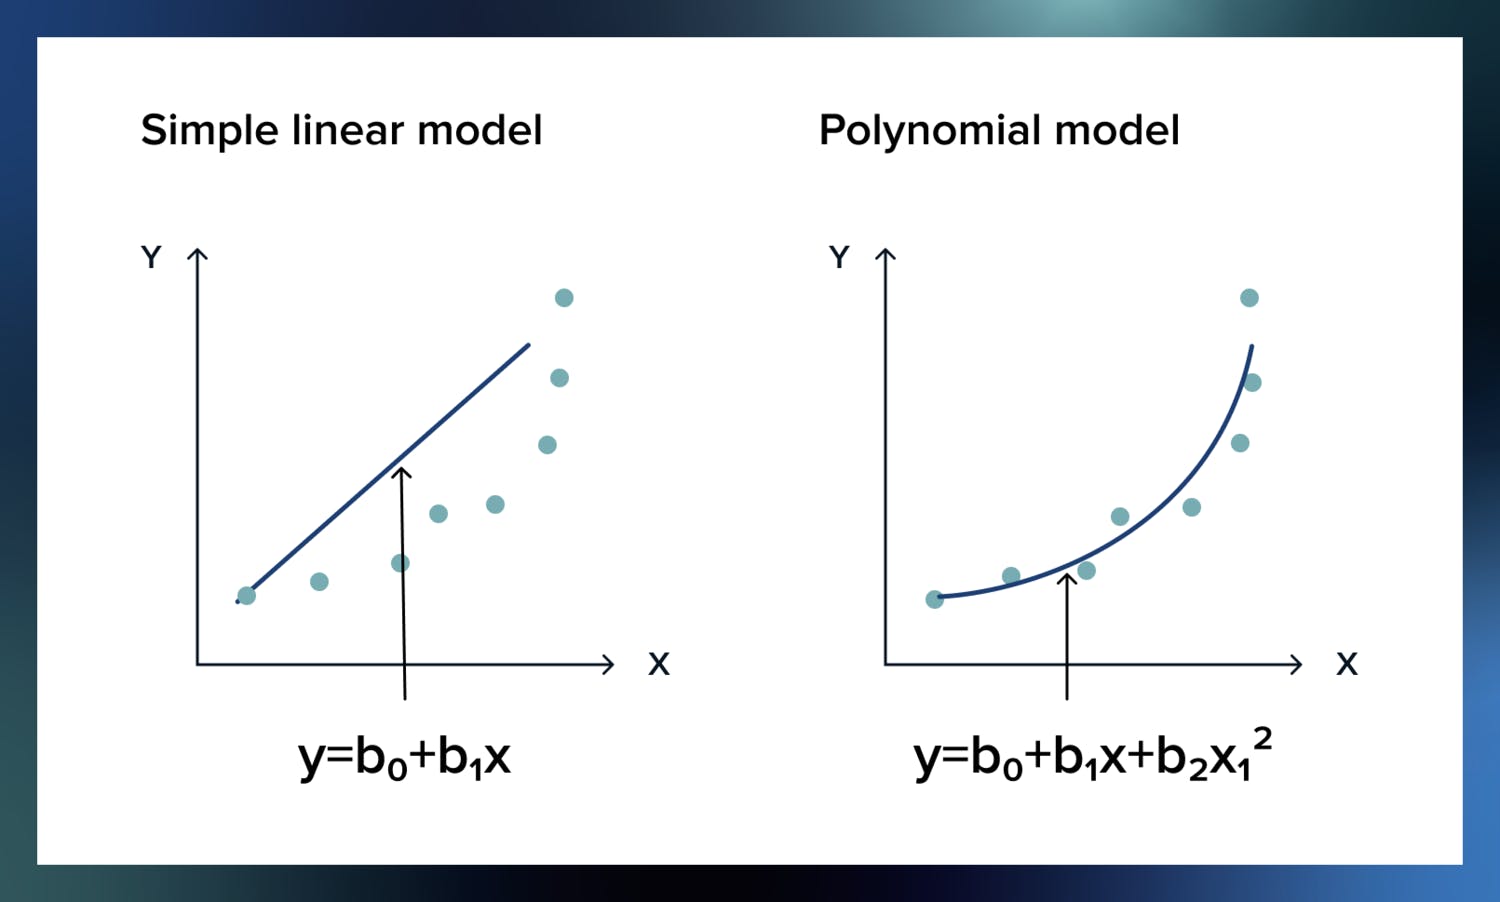
Now, it's up to the user to decide the degree of the polynomial which would also mean that the model will have more coefficients to find values for if the degree is higher. This kind of parameter that the user decides and something that directs the model on a deeper level is called a Hyperparameter. If the user thinks that the model would fit the data if the degree is 3 then the user can provide the value as a hyperparameter to the model. The polynomial regression method is useful for data that varies exponentially unlike simple linear regression. An example of that would be

As you can see from the image above, using simple linear regression on the dataset wouldn't have yielded any proper model, but using polynomial regression gives us a much better fit. Also, it's polynomial linear regression, cause the coefficients are having the power 1.
If you didn't understand many of the stuff mentioned above, then just google it, don't think too much about it. Seriously, it's good practice.
If you have reached the end of this article, then I feel most obliged. Hope my article has brought something of value to you ;). Feel free to like or not like this article. And pls share your thought as comments if you have any.
If you are a fan of newsletters, you can subscribe to my newsletter, given below.
You can also follow me on Hashnode and other platforms if you like my writing.
Help your friends out by sharing this article. Cheers!

