Photo by Carlos Muza on Unsplash
Comparing different regression algorithms
How do we know that which regression algorithm is more suitable for a particular dataset
Table of contents
What is the purpose of comparing algorithms?
In the field of machine learning, regression algorithms help us find a trend or a relationship between the input and the output by giving us the regression line. Now, different regression algorithms have their own way of finding out the most suitable regression line, which also depends on the way the data points are arranged. As engineers ourselves, it is our job to select the most suitable regression method. But, it would be quite helpful for us, if there were a metric defined to compare the performance of the algorithms.
The R-Squared Intuition
Now, we are going to get into some really simple math intuition used in regression algos. Now, regression methods use something called the residual sum of squares(SSres) and the total sum of squares(SStot).

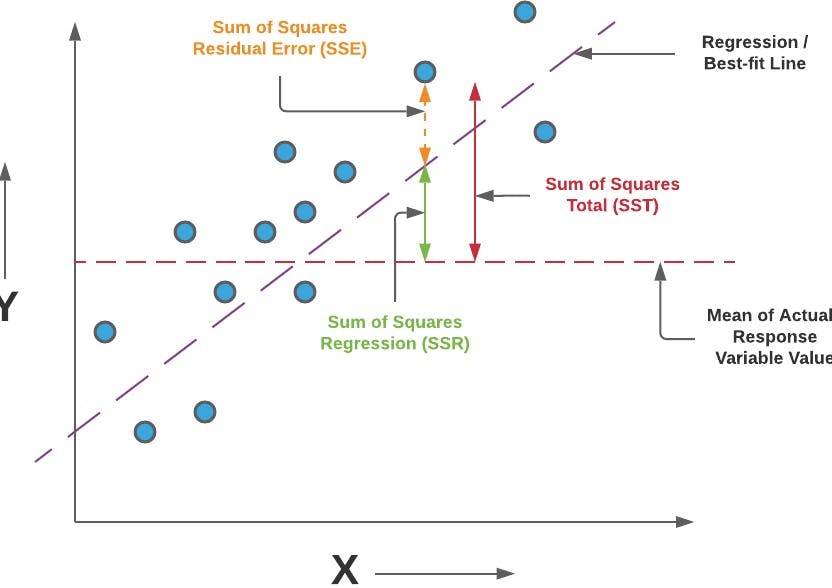
If we look at the above picture, what we see are the two quantities denoted as SSE and SST. So the residual sum of squares is the total sum of squares(i.e for all the data points) of the distance between the predicted point(i.e the purple regression line) and the data points. Mathematically, the residual sum of squares can be written as
SSres = Sum((yi - yi)^2)
where yi represents the i-th data point and the yi represents the corresponding data point on the regression line.
Now, the total sum of squares(SST) represented by the red arrow is similar to the residual sum of squares, except for the fact that there is a dotted red line parallel to the x-axis, that represents the average value of y for the given data points. Now, the total sum of squares is equal to the total sum of squares of the distance between each data point and the red line representing the average value of y. Mathematically,
SStot = Sum((yi - Yavg)^2)
where yi has its original meaning and Yavg is the average of value of y for all the data points.
Now, the R-Squared metric is used to compare or check the performance of an algorithm on a dataset. Given, that we have gotten through the simple math discussed above, now it's time to get into the mathematical definition of R-Squared
R^2 = 1 - SSres/SStot
Now, generally as per this formula, we will be getting values between 0 and 1 for R. The reason for this is quite simple and intuitive. The value of SStot will mostly be greater than the value of SSres because distances calculated in SSres and very optimum and close to actual data points whereas the distances calculated in SStot are larger. After all, it is calculated from just a particular value of y, i.e the avg line. So, naturally, the SStot will be greater.
Based on different values of R, we can make the following judgments
if R = 1, it's suspicious cause it is perfect and indicates overfitting of data
if R ~ 0.9, then it fits very well
if R < 0.7, then the algo is not great for the dataset
if R < 0.4, then it's terrible
if R < 0, then the model makes no sense for the dataset
Now, there can be cases where the SStot being less than SSres has some importance, but we are not going to discuss that here. So, we have discussed the R-Squared Intuition and if you want to implement this metric at the end of your model, you can use the following python script
from sklearn.metrics import r2_score
r2_score(y_test, y_pred)
where y_test is the test set and y_pred is the predicted output for the test set.
If you didn't understand any of what I have written above, then just go google it and develop a habit around it.
If you have reached the end of this article, then I feel most obliged. Hope my article has brought something of value to you ;). Feel free to like or not like this article. And pls share your thought as comments, if you have any.
If you are a fan of newsletters, you can subscribe to my newsletter, given below.
You can also follow me on Hashnode and other platforms if you like my writing.
Help your friends out by sharing this article. Cheers!
