The K-Nearest Neighbors or the K-NN algorithm is one of the simpler algorithms used in classification problems. The working mechanism of the algorithm is quite intuitive and it can be used for both regression and classification problems.
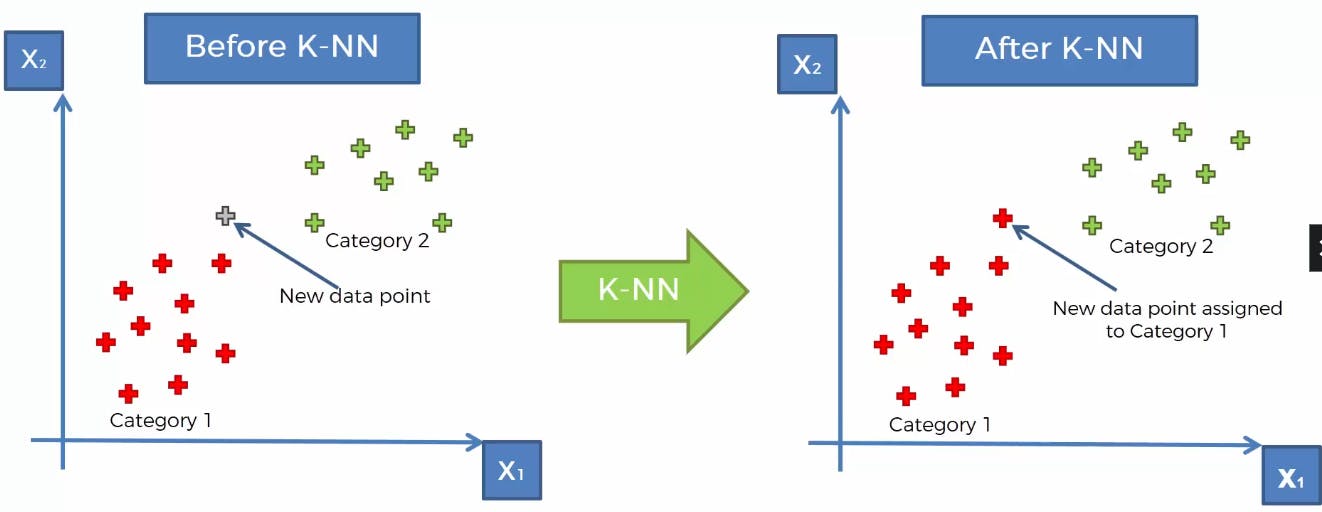
Now, consider the following example of a plot for the two labels X1 and X2.

On the left-hand side, we have a plot where the data is divided into 2 categories X1 and X2. And, we have a new data point in the picture. Now, once we apply the K-NN algorithm, the model classifies the new data point to be in the red category, i.e Category 1.
Now, the most obvious question is, how does it happen?
We shall now look at the flow of the model based on the K-NN algorithm to find the answer.
The flow of the Algorithm
The model first chooses k no. of neighbor data points around the new data point(it's a hyperparameter, but by default, it chooses 5). The method the model uses to find the k nearest neighbors is by finding the least Euclidean distance from the data point. Now, what's Euclidean distance? It's something you have probably studied in school.
if there are two points having coordinates (x1, y1) and (x2, y2), then the Euclidean distance between them is defined as
$$\sqrt((x1-x2)^2 + (y1-y2)^2)$$
In this manner, the algorithm finds the nearest 5 neighbors of the new data point.
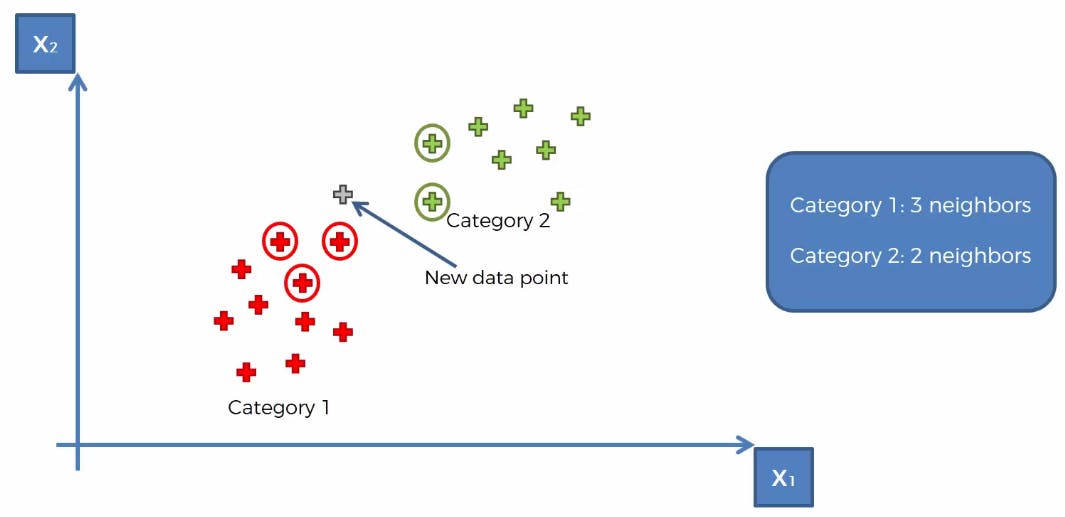
The model then calculates the number of the nearest neighbors that belong to each category and classifies the new data point into the category that has the highest number of nearest neighbors.
As shown in the below plot

We see from the above plot, that the number of nearest neighbors in the red category is greater than in the green category. Therefore, if you refer to the first plot in this article, the model classifies the new data point in the red category, i.e Category 1.
Simple, isn't it? Well, this algorithm finds its usage in regression problems too, but we will cover it in a different article. For now, let's look into the limitations of this method.
Limitations of the K-NN model
Huge Dataset - This model makes it much more computationally expensive in case the dataset is large. This is because the K-NN algorithm requires finding the distances between the new data point and all the data points to find the nearest neighbors. This grows exponentially as more data points come into the picture.
Outliers - It is very sensitive to outliers, as it can consider outliers to be the nearest neighbors and can predict unwanted results.
Missing values - It can lead to the absence of valuable data points, that could help the model predict with greater accuracy. However, this problem can be solved using imputation, which is the process of filling the empty values through various processes such as mean imputation(replacing the missing values with the mean of all the data points), median imputation, k-nearest neighbor imputation etc.
So, that's it for the article. If you didn't understand something from this piece then I encourage you to google it or YouTube it. And this was just a simplistic view of the K-NN algorithm, you can go deeper into that.
If you have reached the end of this article, then I feel most obliged. Hope my article has brought something of value to you ;). Feel free to like or not like this article. And pls share your thoughts as comments, if you have any.
If you are a fan of newsletters, you can subscribe to my newsletter, given below.
You can also follow me on Hashnode and other platforms if you like my writing.
Help your friends out by sharing this article. Cheers!

